- Análisis
- Principales Ganadores/Perdedores
Top Gainers and Losers: Japanese Yen and South African Rand
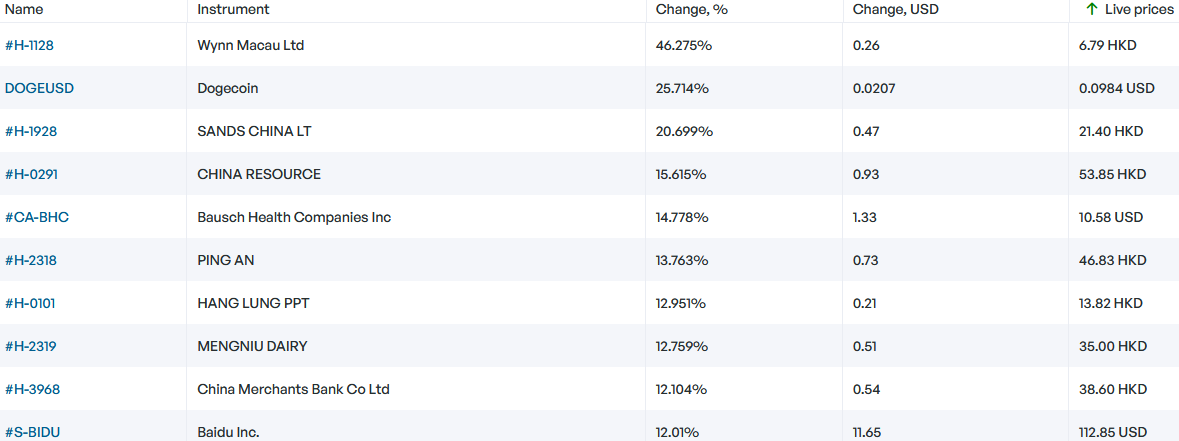
Top Gainers - global market
Over the past 7 days, the US dollar index continued to decline and updated a 5-month low. Based on US statistics, market participants expect a slowdown in the Fed rate growth. According to CME FedWatch, at the next Fed meeting on December 14, it will be increased by only 0.5% to 4.5% with a probability of about 80%. Earlier, the US regulator raised the rate by 0.75% 4 times in a row. The 10-Year US Treasury yield hit a new 9-week low of 3.5% on Friday. The weakening of the South African rand came amid risks of impeachment of South African President Cyril Ramaphosa. The Canadian dollar fell against the backdrop of falling oil and gas prices. In addition, investors expect the Bank of Canada rate to increase by only 0.25% to 4% at the meeting on December 7 from the current level of 3.75%. The Japanese yen continued to strengthen from its 30-year low, which looks like a USDJPY high. Earlier, the Bank of Japan (-0.1%) said it would not allow the yen to weaken too much. Recall that the meeting will be held on December 20.
1. DOGEUSD, +25.7% – Dogecoin cryptocurrency (DOGE)
2. Wynn Macau, Limited, +46.3% – casino and hotel management company in Macau
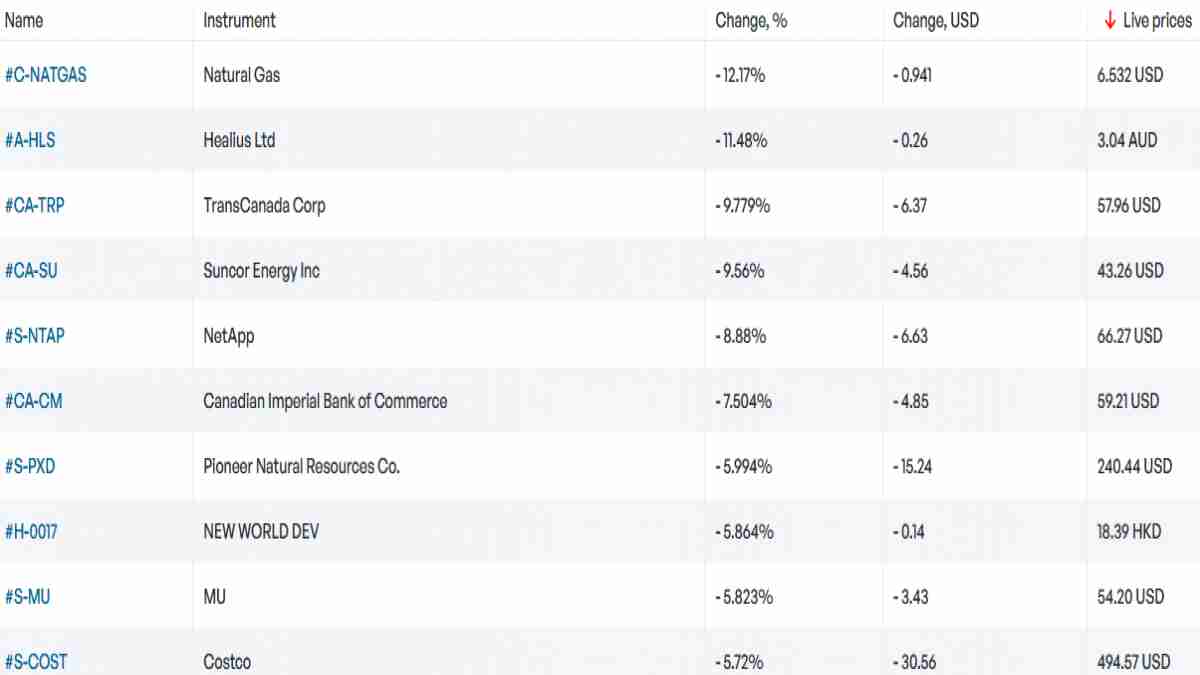
Top Losers - global market
1. Henry Hub Natural Gas Futures CFD – US natural gas
2. Healius Ltd. – Australian health insurance company.
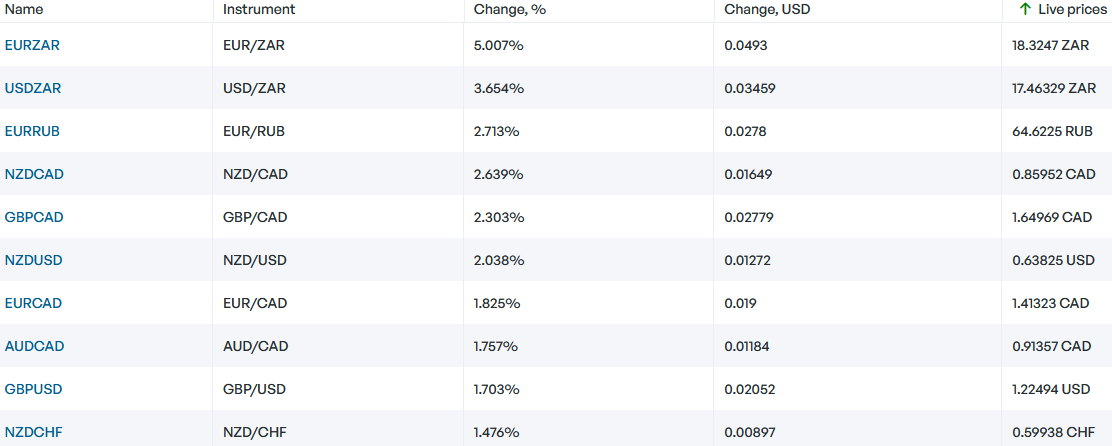
Top Gainers - foreign exchange market (Forex)
1. EURZAR, USDZAR - the growth of these graphs means the strengthening of the euro and the US dollar against the South African rand.
2. NZDCAD, GBPCAD - the growth of these graphs means the weakening of the Canadian dollar against the New Zealand dollar and the British pound.
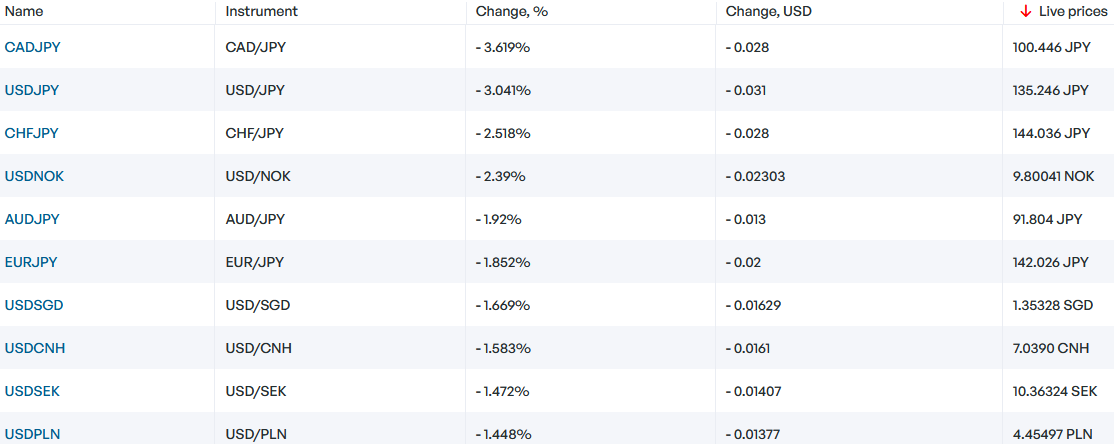
Top Losers - foreign exchange market (Forex)
1. CADJPY, CHFJPY - the decline of these graphs means the weakening of the Canadian dollar and the Swiss franc against the Japanese yen.
2. USDJPY, USDNOK - the decline in these graphs means the strengthening of the Japanese yen and the Norwegian krone against the US dollar.
Nueva herramienta analítica exclusiva
Cualquier rango de fechas - de 1 día a 1 año
Cualquier grupo de trading: Forex, Acciones, Índices, etc.
Nota:
Este resumen tiene carácter informativo-educativo y se publica de forma gratuita. Todos los datos que contiene este resumen, son obtenidos de fuentes públicas que se consideran más o menos fiables. Además, no hay niguna garantía de que la información sea completa y exacta. En el futuro, los resúmenes no se actualizarán. Toda la información en cada resumen, incluyendo las opiniones, indicadores, gráficos y todo lo demás, se proporciona sólo para la observación y no se considera como un consejo o una recomendación financiera. Todo el texto y cualquier parte suya, así como los gráficos no pueden considerarse como una oferta para realizar alguna transacción con cualquier activo. La compañía IFC Markets y sus empleados en cualquier circunstancia no son responsables de ninguna acción tomada por otra persona durante o después de la observación del resumen.
- Obtener certificado


Anterior Top Ganadores y Perdedores
Over the past 7 days, the American dollar has remained almost unchanged. According to the CME FedWatch tool, there is an 89% probability of the U.S. Federal Reserve raising interest rates at the meeting on July 26th. The Swiss franc has strengthened due to positive economic indicators such as Credit...
Durante los últimos 7 días, el índice del dólar estadounidense ha disminuido. Como era de esperar, la Reserva Federal (Fed) mantuvo su tasa de interés en 5,25% durante la reunión del 14 de junio. Ahora, los inversores están monitoreando las estadísticas económicas y tratando de pronosticar el...
Durante los últimos 7 días, el índice del dólar estadounidense no ha cambiado mucho. Ha estado cotizando en un rango estrecho de 103,2-104,4 puntos por cuarta semana. Los inversores esperan el resultado de la reunión de la Fed del 14 de junio. Las acciones de Tesla subieron por la apertura de nuevas...