- Análisis
- Análisis Técnico
Cacao Análisis Técnico - Cacao Trading: 2018-12-18
Drought can reduce crop yields
There is a drought in West Africa. Will Cocoa prices rise?
From November to February, a dry season has been observed in Côte d'Ivoire, Ghana, Nigeria, Togo and Cameroon. These five African countries account for three quarters of the world's cocoa production. This year, the drought is stronger there than usual, which can damage crop yields. The US National Weather Service's Climate Prediction Center (CPC) forecasts a 90% chance of formation of the natural phenomenon El Niño in winter of 2018/19 and a 60% probability of its formation in spring of 2019. At the same time, the CPC expects the current El Niño to be weak. The last time it was formed in 2015-2016, and during that period of time, the price of beans exceeded $3000 per ton. It should be noted that currently there is no shortage of cocoa in the world, so the dynamics of quotations can strongly depend on the weather in West Africa.
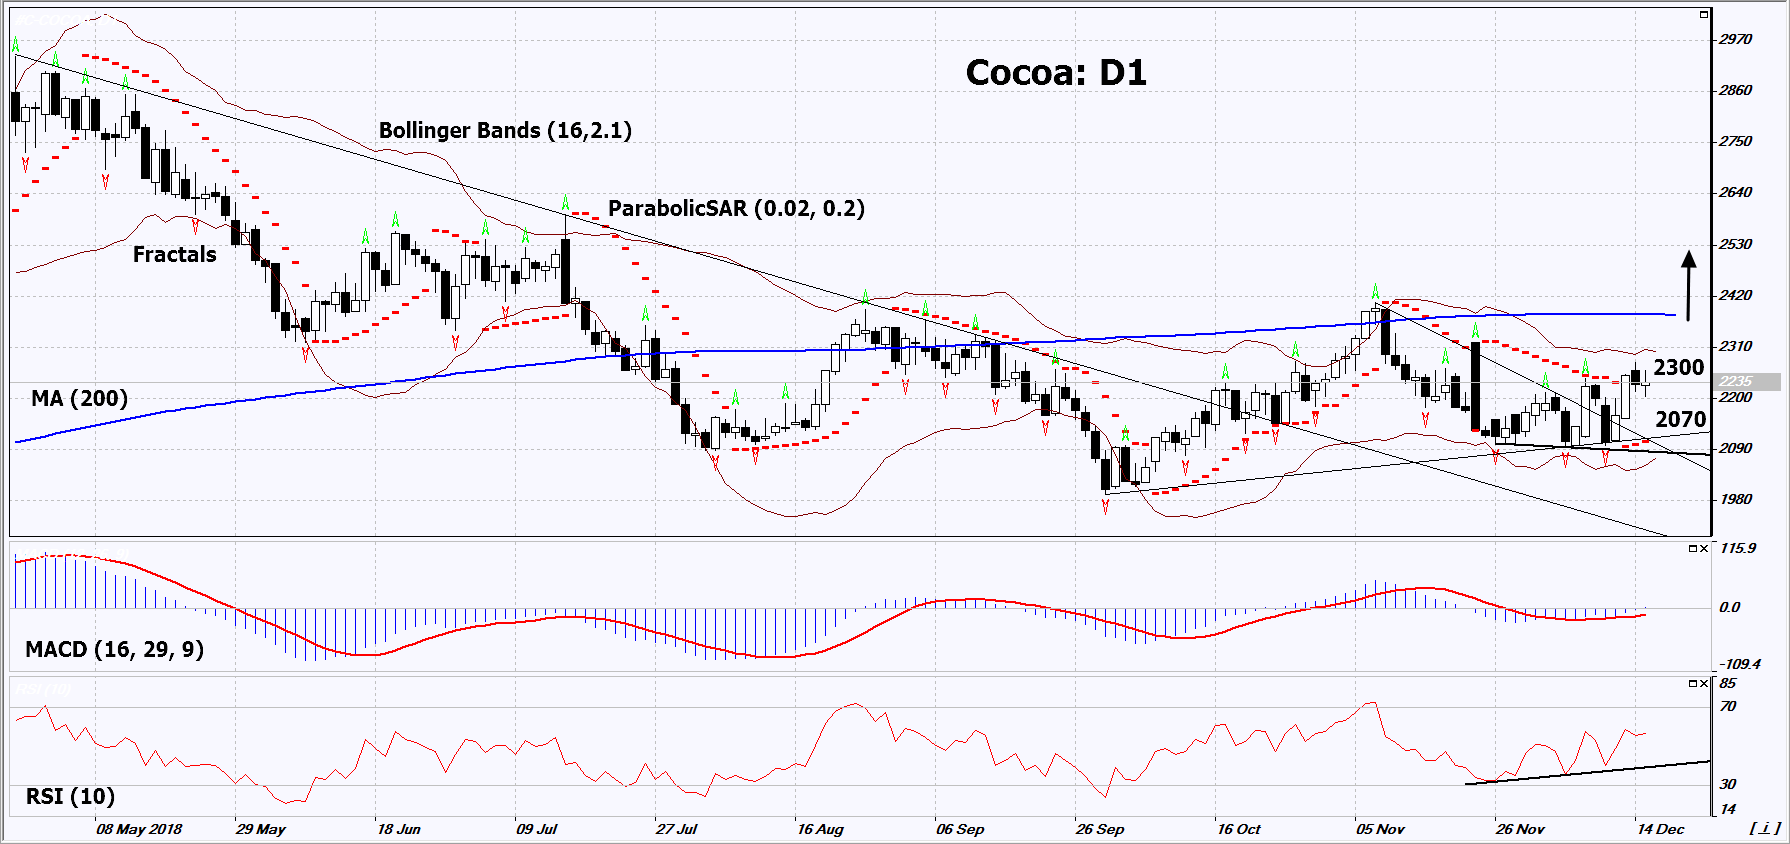
On the daily timeframe, Cocoa: D1 is moving upward within a rising trend. The further price increase is possible in case of a reduction in crop yields in the countries of West Africa.
- The Parabolic indicator gives a bullish signal.
- The Bollinger bands have narrowed, which indicates low volatility. The lower band is titled upward.
- The RSI indicator is above 50. It has formed a positive divergence.
- The MACD indicator gives a bullish signal.
The bullish momentum may develop in case Cocoa exceeds the last fractal high and the upper Bollinger band at 2300. This level may serve as an entry point. The initial stop loss may be placed below the two last fractal lows, the Parabolic signal and the lower Bollinger band at 2070. After opening the pending order, we shall move the stop to the next fractal low following the Bollinger and Parabolic signals. Thus, we are changing the potential profit/loss to the breakeven point. More risk-averse traders may switch to the 4-hour chart after the trade and place there a stop loss moving it in the direction of the trade. If the price meets the stop level (2070) without reaching the order (2300), we recommend to close the position: the market sustains internal changes that were not taken into account.
Summary of technical analysis
| Position | Buy |
| Buy stop | Above 2300 |
| Stop loss | Below 2070 |
- Obtener certificado

Nota:
Este resumen tiene carácter informativo-educativo y se publica de forma gratuita. Todos los datos que contiene este resumen, son obtenidos de fuentes públicas que se consideran más o menos fiables. Además, no hay niguna garantía de que la información sea completa y exacta. En el futuro, los resúmenes no se actualizarán. Toda la información en cada resumen, incluyendo las opiniones, indicadores, gráficos y todo lo demás, se proporciona sólo para la observación y no se considera como un consejo o una recomendación financiera. Todo el texto y cualquier parte suya, así como los gráficos no pueden considerarse como una oferta para realizar alguna transacción con cualquier activo. La compañía IFC Markets y sus empleados en cualquier circunstancia no son responsables de ninguna acción tomada por otra persona durante o después de la observación del resumen.
